
Edmonton recorded tens of thousands of police-reported incidents from March 2024 to March 2025, with overall crime showing a slight decrease amid shifts in crime types. According to Edmonton Police Service (EPS) year-end statistics, the total number of criminal incidents city-wide fell by about 2.5% in 2024, reaching the lowest crime rate in over a decade. In contrast, violent incidents edged up by 1.8% during the same period. This indicates that while Edmonton saw fewer crimes overall, certain serious offenses became more frequent. Police note that calls for service rose by 5.1%, suggesting greater reporting and proactive policing. The data highlights a complex picture: declining crime rates alongside persistent concerns about violence and disorder in the community.
Crime in Edmonton fluctuated with the seasons. Warmer months saw significantly higher incident volumes than colder months. Reported incidents climbed steadily through spring 2024 and peaked in the summer. For example, August 2024 recorded nearly 7,400 occurrences, compared to roughly 5,100 in February 2025 (the lowest point). This seasonal trend is common – longer daylight hours and summer activities tend to coincide with more property crimes and public interactions. As autumn set in, incident counts declined, continuing to drop through the winter. By early 2025, monthly totals were considerably lower than the summer peak. Despite these swings, Edmonton’s year-end crime rate was down 2.5% from the previous year, indicating an overall improvement even with the mid-year surge. Police and community initiatives during the winter months may have contributed to sustaining lower crime levels into 2025.
Property-related offenses overwhelmingly accounted for the majority of incidents. Non-violent property crimes – including thefts, break-ins, and fraud – made up nearly 60% of all reports in the dataset. The single most frequent offense was “Theft Under $5000.” The dataset contains thousands of these theft entries, often occurring at retail and commercial areas. Other common property crimes were break-and-enters (residential and commercial) and vehicle thefts, which together contributed a substantial share of calls. By comparison, violent crimes (such as assault, robbery, and sexual offenses) formed about 10% of reported incidents. There were still hundreds of assaults each month – peaking in early summer – but overall violent crime remained relatively steady, rising slightly year-over-year. Disorder and mischief calls were the second-largest category (around 25% of incidents), reflecting social issues like vandalism and disturbances. Many disorder calls were logged as “Trouble with Person,” indicating disputes or unwanted persons in public. Smaller fractions of the reports involved drug offenses, traffic violations (e.g. impaired driving), and weapons complaints. This breakdown underscores that day-to-day crime in Edmonton is largely non-violent – focused on property and disorder – although violent and weapons-related incidents remain a concern.
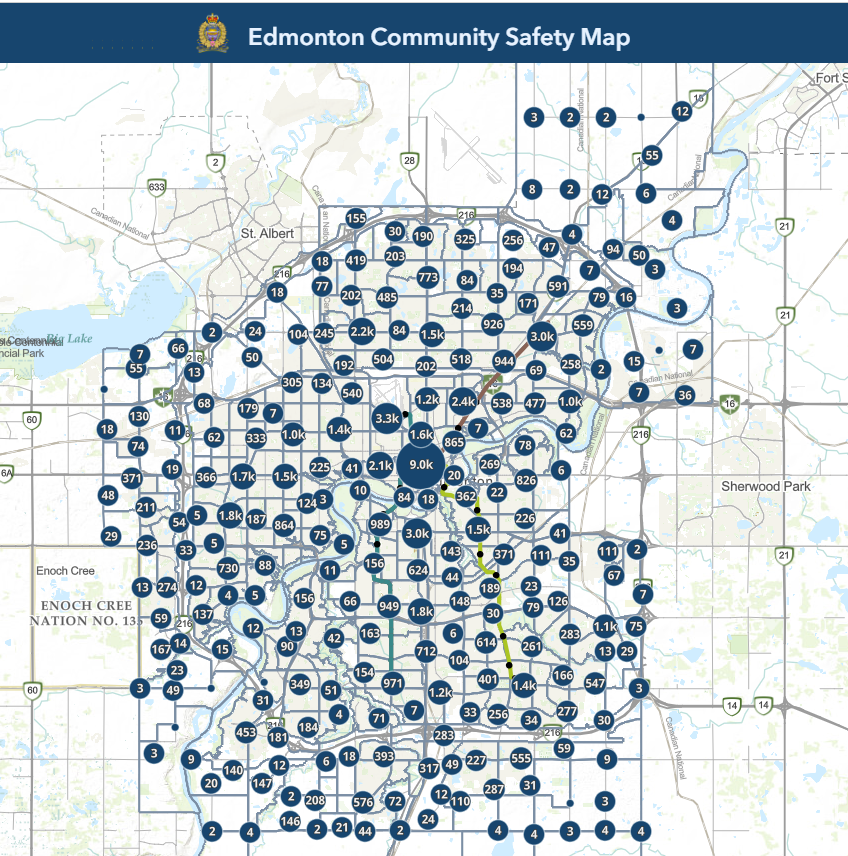
Certain intersections and areas emerged as crime hotspots in the data. The downtown core and busy commercial zones saw the highest concentration of incidents. For instance, the intersection of Airport Road and Kingsway appears frequently in the reports. This location alone was cited in hundreds of incidents, often for “Theft Under $5000” cases. Another notable hotspot is the area around 137 Avenue in north Edmonton, which had numerous property crime reports – the data shows entries like “Break and Enter Commercial, 137 AV/163 ST” in that corridor.
Large transit hubs and shopping districts also feature prominently. The Northgate Transit Centre in north Edmonton, for example, shows repeated incidents in the dataset ranging from thefts to assaults. Similarly, the Capilano area in the east (near Capilano Mall) and Southgate Transit Centre in the south each logged over a hundred incidents, indicating they are frequent spots for police calls. Busy road intersections that double as commercial strips – such as 178 ST/89 AV in west Edmonton (near West Edmonton Mall) – also had high incident counts. These hotspots correspond to places where large numbers of people circulate: shopping malls, transit stations, and main thoroughfares. The clustering of red markers on the map confirms heavier crime density in central and high-traffic neighborhoods. By contrast, many residential suburbs and industrial outskirts show relatively few reported incidents. Identifying these hotspots helps EPS target patrols and resources, focusing on areas with persistent theft, disorder, and violence issues.
Several notable crime patterns emerged over the past year. One was a spike in weapons-related calls near the end of 2024. In particular, “Weapons Complaint – Firearm” incidents surged in December 2024, far above the typical monthly levels. This unusual jump in firearm-related complaints (many of which may involve reports of guns or gunshots) stood out against the overall downtrend in firearm crimes for 2024. In fact, police statistics show criminal incidents involving firearms decreased by about 10.9% in 2024, even as knife-related incidents rose slightly
The December surge may reflect heightened public vigilance or isolated events and is likely a focus for investigators moving into 2025. Another trend was the high volume of fraud and online crime reports. The data contains steady monthly reports of scams such as “Fraud – Financial” and “Internet Fraud,” suggesting cybercrime and phone scams continue to affect Edmonton residents. These incidents, while non-violent, can have significant financial and emotional impact on victims, and their persistence indicates an ongoing challenge for law enforcement.
Transit safety has been an ongoing concern, but the data offers a somewhat positive narrative on this front. EPS noted that while calls for service at LRT stations and transit centres increased by 12% in 2024 (likely due to more officers patrolling transit), the average crime severity at these locations fell by 6%
This implies that although more incidents are being reported on transit (including minor offenses or proactive checks), serious crimes on transit did not rise in tandem. Common transit-related incidents in the dataset include mischief, liquor violations, and minor assaults at hubs like Belvedere, Coliseum, and Southgate. These findings suggest that increased police presence on transit is improving safety, addressing issues before they escalate.
The overall reduction in Edmonton’s crime rate is a positive sign, but the daily reality of crime still impacts communities. Property crimes, especially thefts and break-ins, can undermine residents’ sense of security and impose financial hardships on businesses and individuals. Disorder incidents – from graffiti to people causing disturbances – often contribute to perceptions that an area is unsafe. “We continue to hear from our community about the disorder they are seeing every day in their neighbourhoods and the ways in which it impacts how safe people feel,” EPS Chief Dale McFee said in a year-end statement. This underscores that statistical improvements do not always immediately translate to public peace of mind. Residents in hotspot areas (downtown, transit zones, etc.) may still feel vulnerable due to visible crime and social disorder.
Edmonton police have responded to these concerns with targeted strategies. More officers are conducting proactive patrols in high-crime areas and on transit, which has led to increased officer-generated calls for service. Initiatives like the Community Safety Teams and high-risk encampment response units were mentioned by Chief McFee as efforts to tackle root causes and prevent issues from “escalating into larger issues”. The aim is to balance enforcement with support services – for example, connecting vulnerable individuals to shelters or addiction resources – to reduce recurring calls. Going into 2025, EPS and community partners are focusing on emerging trends such as the spike in weapons complaints and the steady prevalence of property crime. Continued collaboration is emphasized as key: policing, social services, businesses, and residents all have a role in maintaining the downward trend in crime. The data-driven identification of hotspots and patterns enables a more efficient, targeted response, which, if sustained, bodes well for improving public safety and community confidence in the long term.