According to the crime statistics, Vancouver’s crime rates show both progress and ongoing challenges. The data from January to June 2024 provides detailed insights into the distribution of various crime incidents across different neighbourhoods in the city. A comparison with the same period in 2023 reveals both increases and decreases in certain types of crime, highlighting areas where safety has improved and where it may still need attention.
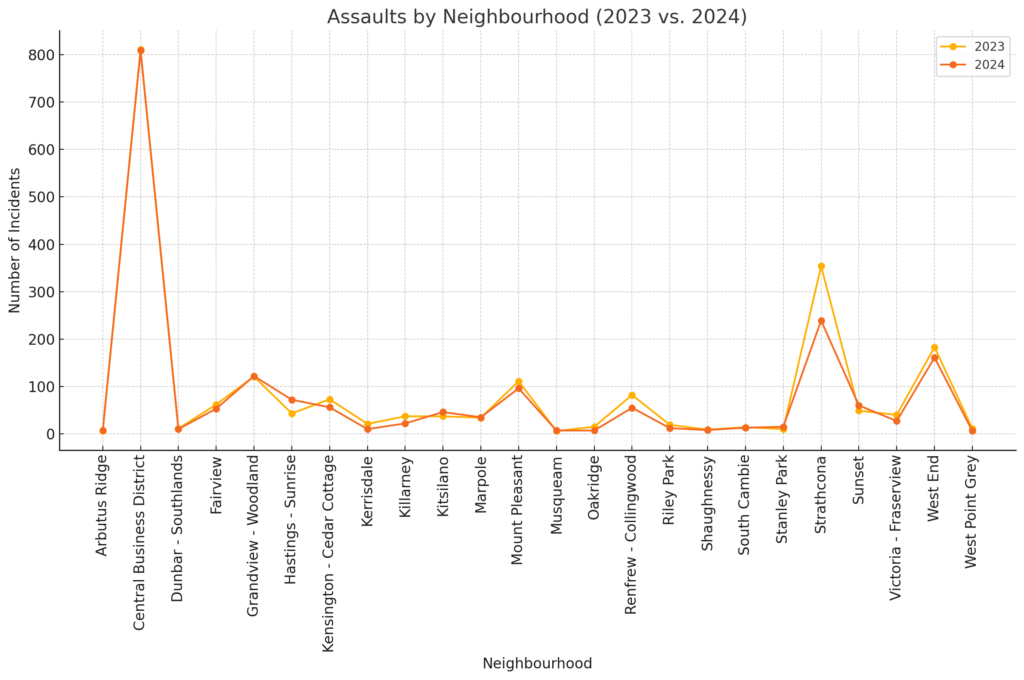
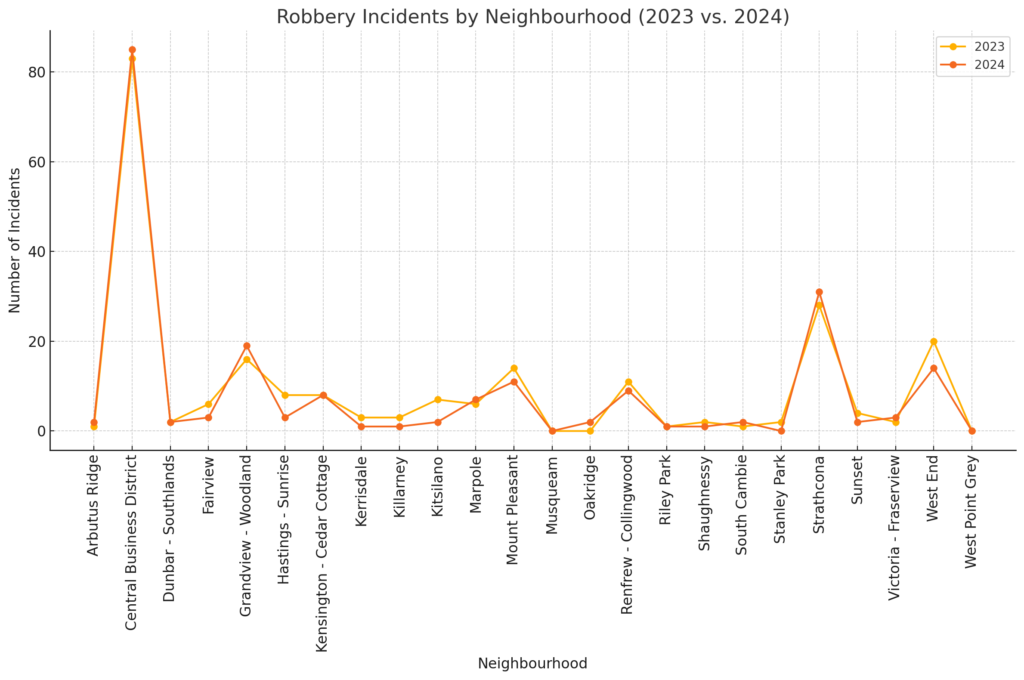
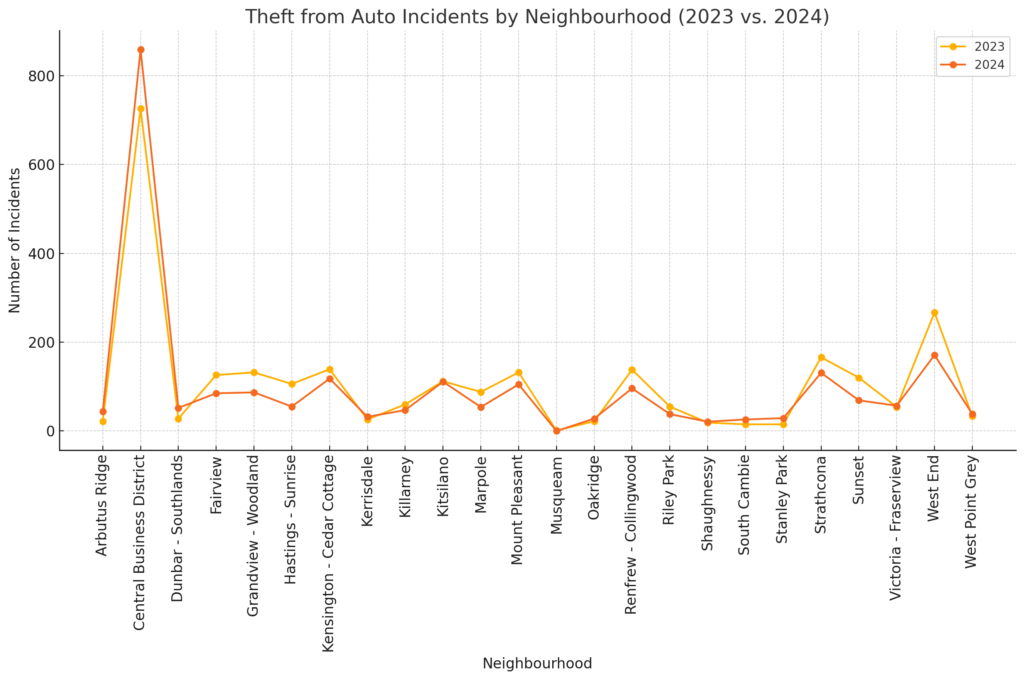
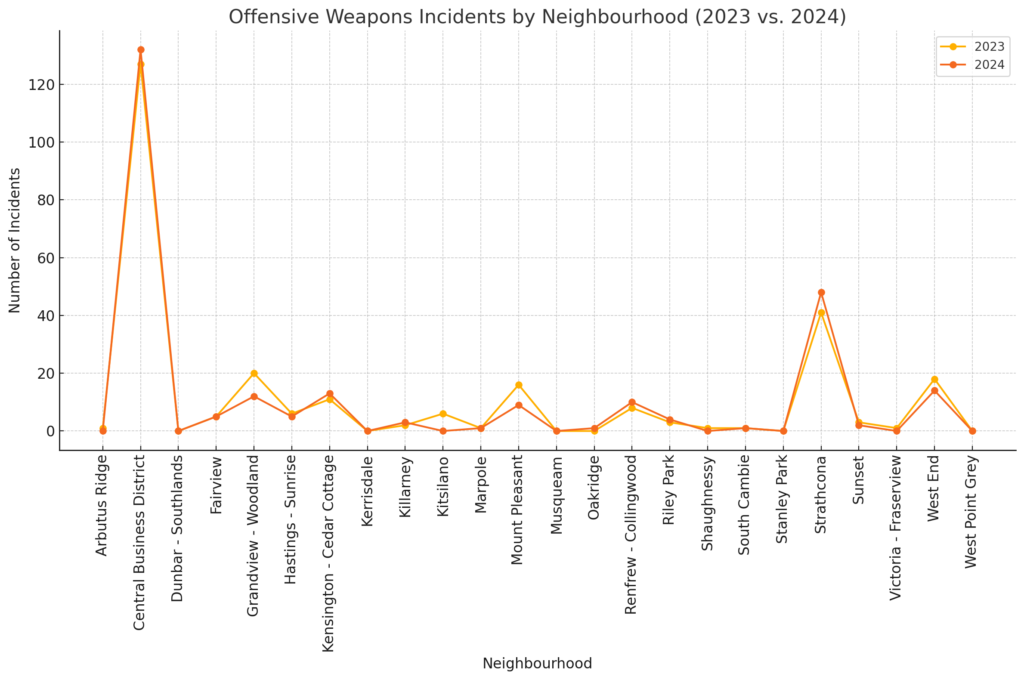
The Central Business District remains a major concern for law enforcement with a significant number of incidents. This year, theft from auto incidents reached 1,214, a slight decrease from 1,255 in the same period last year. Assaults in this area saw a minor reduction from 811 in 2023 to 809 in 2024. However, robbery incidents rose from 83 to 85, and offensive weapon cases increased from 127 to 132, indicating an ongoing challenge in managing violent crimes in this densely populated area.
Grandview-Woodland experienced mixed results. While sex offences dropped from 18 in 2023 to 12 in 2024, arson incidents increased from 15 to 7. Similarly, assaults remained nearly constant, with a marginal increase from 121 to 122. Robberies saw a slight increase from 16 to 19, and the number of offensive weapons incidents remained relatively high, with a decrease from 20 to 12.
In Strathcona, there was a notable decrease in sex offences, from 18 in 2023 to 8 in 2024. However, robbery incidents increased from 28 to 31, and the neighbourhood saw a rise in arson cases from 30 to 21. Assaults in this area decreased significantly from 354 to 239, which is a positive sign for the community’s overall safety.
Detailed Crime Statistics by Neighbourhood
Central Business District
- Assaults: Decreased from 811 in 2023 to 809 in 2024
- Robbery: Increased from 83 in 2023 to 85 in 2024
- Theft from Auto: Decreased from 1,255 in 2023 to 1,214 in 2024
- Offensive Weapons: Increased from 127 in 2023 to 132 in 2024
Grandview-Woodland
- Sex Offences: Decreased from 18 in 2023 to 12 in 2024
- Arson: Increased from 15 in 2023 to 7 in 2024
- Assaults: Increased from 121 in 2023 to 122 in 2024
- Robbery: Increased from 16 in 2023 to 19 in 2024
- Offensive Weapons: Decreased from 20 in 2023 to 12 in 2024
Strathcona
- Sex Offences: Decreased from 18 in 2023 to 8 in 2024
- Robbery: Increased from 28 in 2023 to 31 in 2024
- Arson: Decreased from 30 in 2023 to 21 in 2024
- Assaults: Decreased from 354 in 2023 to 239 in 2024
Comparing the data from January to June of both 2023 and 2024, the overall crime incidents show varied trends across different neighbourhoods. While some areas like Strathcona have seen improvements in reducing certain crimes, others like the Central Business District continue to struggle with high rates of theft and violent incidents. The data highlights the need for targeted interventions and community engagement to address the unique challenges each neighbourhood faces. Total sex offences increased significantly from 228 in 2023 to 380 in 2024. Similarly, total assaults rose from 1,948 in 2023 to 2,073 in 2024, and total robberies climbed from 209 in 2023 to 286 in 2024. The number of break and enter (B&E) incidents also saw a rise, going from 764 in 2023 to 925 in 2024. However, theft of motor vehicles (MV) decreased from 230 in 2023 to 174 in 2024. Despite this, theft from auto increased from 2,353 in 2023 to 2,558 in 2024. Total theft over $5K saw a slight decrease from 4,221 in 2023 to 4,092 in 2024. Arson incidents dropped from 113 in 2023 to 66 in 2024, while total mischief cases decreased from 1,798 in 2023 to 1,616 in 2024. Finally, total offensive weapons incidents were halved, decreasing from 279 in 2023 to 140 in 2024.
To provide a clearer picture of the crime trends, the following graphs illustrate the changes in major crime categories across different neighbourhoods:


The mid-year crime statistics for Vancouver highlight both successes and ongoing challenges in the city’s fight against crime. While some neighbourhoods have made progress in reducing certain types of crime, others continue to face high rates of incidents, necessitating focused efforts and resources from law enforcement and community partners. By understanding these trends, the VPD can better allocate resources and implement strategies to enhance public safety and community well-being.
Total of the crime incident statistics for each neighborhood from February to June 2024
| Neighborhood | Sex | Offences | Assaults | Robbery | B&E | Theft of MV | Theft from Auto | Theft > $5K | Arson | Mischief | Offensive Weapons |
|---|---|---|---|---|---|---|---|---|---|---|---|
| Arbutus Ridge | 4 | 7 | 2 | 7 | 3 | 44 | 42 | 0 | 13 | 0 | 0 |
| Central Business District | 66 | 809 | 85 | 150 | 27 | 859 | 1,214 | 33 | 693 | 180 | 132 |
| Dunbar – Southlands | 2 | 10 | 2 | 10 | 2 | 52 | 32 | 0 | 21 | 0 | 0 |
| Fairview | 9 | 53 | 3 | 51 | 14 | 85 | 163 | 4 | 76 | 6 | 5 |
| Grandview – Woodland | 12 | 122 | 19 | 58 | 22 | 87 | 124 | 7 | 85 | 13 | 12 |
| Hastings – Sunrise | 12 | 72 | 3 | 43 | 18 | 55 | 88 | 6 | 66 | 3 | 5 |
| Kensington – Cedar Cottage | 12 | 56 | 8 | 35 | 8 | 118 | 159 | 8 | 80 | 12 | 13 |
| Kerrisdale | 4 | 10 | 1 | 20 | 4 | 32 | 30 | 2 | 18 | 0 | 0 |
| Killarney | 3 | 22 | 1 | 22 | 8 | 47 | 60 | 2 | 26 | 3 | 3 |
| Kitsilano | 6 | 46 | 2 | 25 | 12 | 111 | 198 | 1 | 30 | 0 | 0 |
| Marpole | 8 | 35 | 7 | 32 | 11 | 54 | 90 | 8 | 33 | 0 | 1 |
| Mount Pleasant | 13 | 96 | 11 | 53 | 13 | 105 | 359 | 3 | 136 | 12 | 9 |
| Musqueam | 3 | 7 | 0 | 0 | 0 | 0 | 3 | 0 | 0 | 0 | 0 |
| Oakridge | 2 | 7 | 2 | 10 | 2 | 28 | 34 | 0 | 16 | 0 | 1 |
| Renfrew – Collingwood | 13 | 55 | 9 | 58 | 19 | 96 | 523 | 3 | 70 | 8 | 10 |
| Riley Park | 6 | 12 | 1 | 12 | 8 | 38 | 26 | 1 | 35 | 3 | 4 |
| Shaughnessy | 1 | 8 | 1 | 12 | 3 | 21 | 17 | 0 | 30 | 0 | 0 |
| South Cambie | 3 | 13 | 2 | 12 | 3 | 26 | 40 | 0 | 14 | 2 | 1 |
| Stanley Park | 4 | 15 | 0 | 2 | 1 | 29 | 17 | 0 | 9 | 0 | 0 |
| Strathcona | 8 | 239 | 31 | 69 | 17 | 131 | 204 | 21 | 147 | 26 | 48 |
| Sunset | 10 | 60 | 2 | 17 | 8 | 69 | 297 | 7 | 43 | 0 | 2 |
| Victoria – Fraserview | 8 | 27 | 3 | 14 | 12 | 57 | 65 | 0 | 24 | 1 | 0 |
| West End | 17 | 161 | 14 | 47 | 13 | 171 | 415 | 7 | 121 | 10 | 14 |
| West Point Grey | 2 | 6 | 0 | 5 | 2 | 38 | 21 | 0 | 12 | 0 | 0 |
| GRAND TOTAL | 380 | 2,073 | 286 | 925 | 174 | 2,558 | 4,092 | 66 | 1,616 | 161 | 140 |
Total of reported crime incident statistics by neighborhood for the months from February to July 2023
| Neighbourhood | Sex Offences | Assaults | Robbery | B&E | Theft of MV | Theft from Auto | Theft > $5K | Arson | Mischief | Offensive Weapons |
|---|---|---|---|---|---|---|---|---|---|---|
| Arbutus Ridge | 3 | 6 | 1 | 27 | 2 | 22 | 27 | 0 | 27 | 1 |
| Central Business District | 59 | 811 | 83 | 303 | 43 | 726 | 1255 | 74 | 1,166 | 127 |
| Dunbar – Southlands | 4 | 11 | 2 | 33 | 4 | 28 | 48 | 1 | 20 | 0 |
| Fairview | 5 | 62 | 6 | 79 | 15 | 126 | 230 | 4 | 118 | 5 |
| Grandview – Woodland | 18 | 121 | 16 | 70 | 28 | 132 | 179 | 15 | 119 | 20 |
| Hastings – Sunrise | 8 | 43 | 8 | 75 | 27 | 106 | 58 | 5 | 58 | 6 |
| Kensington – Cedar Cottage | 13 | 73 | 8 | 39 | 19 | 139 | 143 | 15 | 108 | 11 |
| Kerrisdale | 2 | 21 | 3 | 24 | 4 | 26 | 32 | 2 | 11 | 0 |
| Killarney | 8 | 37 | 3 | 27 | 15 | 60 | 50 | 2 | 27 | 2 |
| Kitsilano | 12 | 37 | 7 | 64 | 6 | 112 | 132 | 4 | 76 | 6 |
| Marpole | 5 | 34 | 6 | 41 | 12 | 88 | 86 | 2 | 44 | 1 |
| Mount Pleasant | 9 | 111 | 14 | 94 | 23 | 132 | 357 | 10 | 156 | 16 |
| Musqueam | 1 | 6 | 0 | 2 | 0 | 1 | 2 | 0 | 1 | 0 |
| Oakridge | 4 | 15 | 0 | 22 | 5 | 22 | 30 | 2 | 17 | 0 |
| Renfrew – Collingwood | 16 | 82 | 11 | 56 | 25 | 138 | 646 | 2 | 61 | 8 |
| Riley Park | 10 | 19 | 1 | 38 | 8 | 55 | 40 | 0 | 28 | 3 |
| Shaughnessy | 7 | 9 | 2 | 24 | 1 | 19 | 19 | 0 | 8 | 1 |
| South Cambie | 3 | 14 | 1 | 30 | 2 | 15 | 54 | 1 | 27 | 1 |
| Stanley Park | 1 | 10 | 2 | 2 | 1 | 15 | 9 | 1 | 5 | 0 |
| Strathcona | 18 | 354 | 28 | 112 | 27 | 166 | 241 | 30 | 209 | 41 |
| Sunset | 11 | 49 | 4 | 34 | 17 | 120 | 391 | 1 | 59 | 3 |
| Victoria – Fraserview | 4 | 40 | 2 | 18 | 18 | 54 | 43 | 0 | 21 | 1 |
| West End | 26 | 183 | 20 | 107 | 18 | 267 | 242 | 10 | 159 | 18 |
| West Point Grey | 3 | 11 | 0 | 17 | 6 | 33 | 22 | 0 | 15 | 0 |
| GRAND TOTAL | 228 | 1948 | 209 | 764 | 230 | 2353 | 4221 | 113 | 1798 | 279 |

